Dashboards
A dashboard shows your project's data as charts, tables and counts. It updates as records arrive, so your team and your stakeholders see the current picture without opening a table.
3D dashboards are built in Metabase, an analytics tool that is part of 3D. An analyst builds a dashboard in Metabase from the project's data and marks it as embeddable. A project manager then adds it to the project as a tab. A project can also have a Project report built in Power BI from the 3D data warehouse.
The Dashboards page
Open Dashboards from the main navigation. Each tab is one dashboard. The first tab opens on its own. A project with no dashboards shows "No Dashboards".
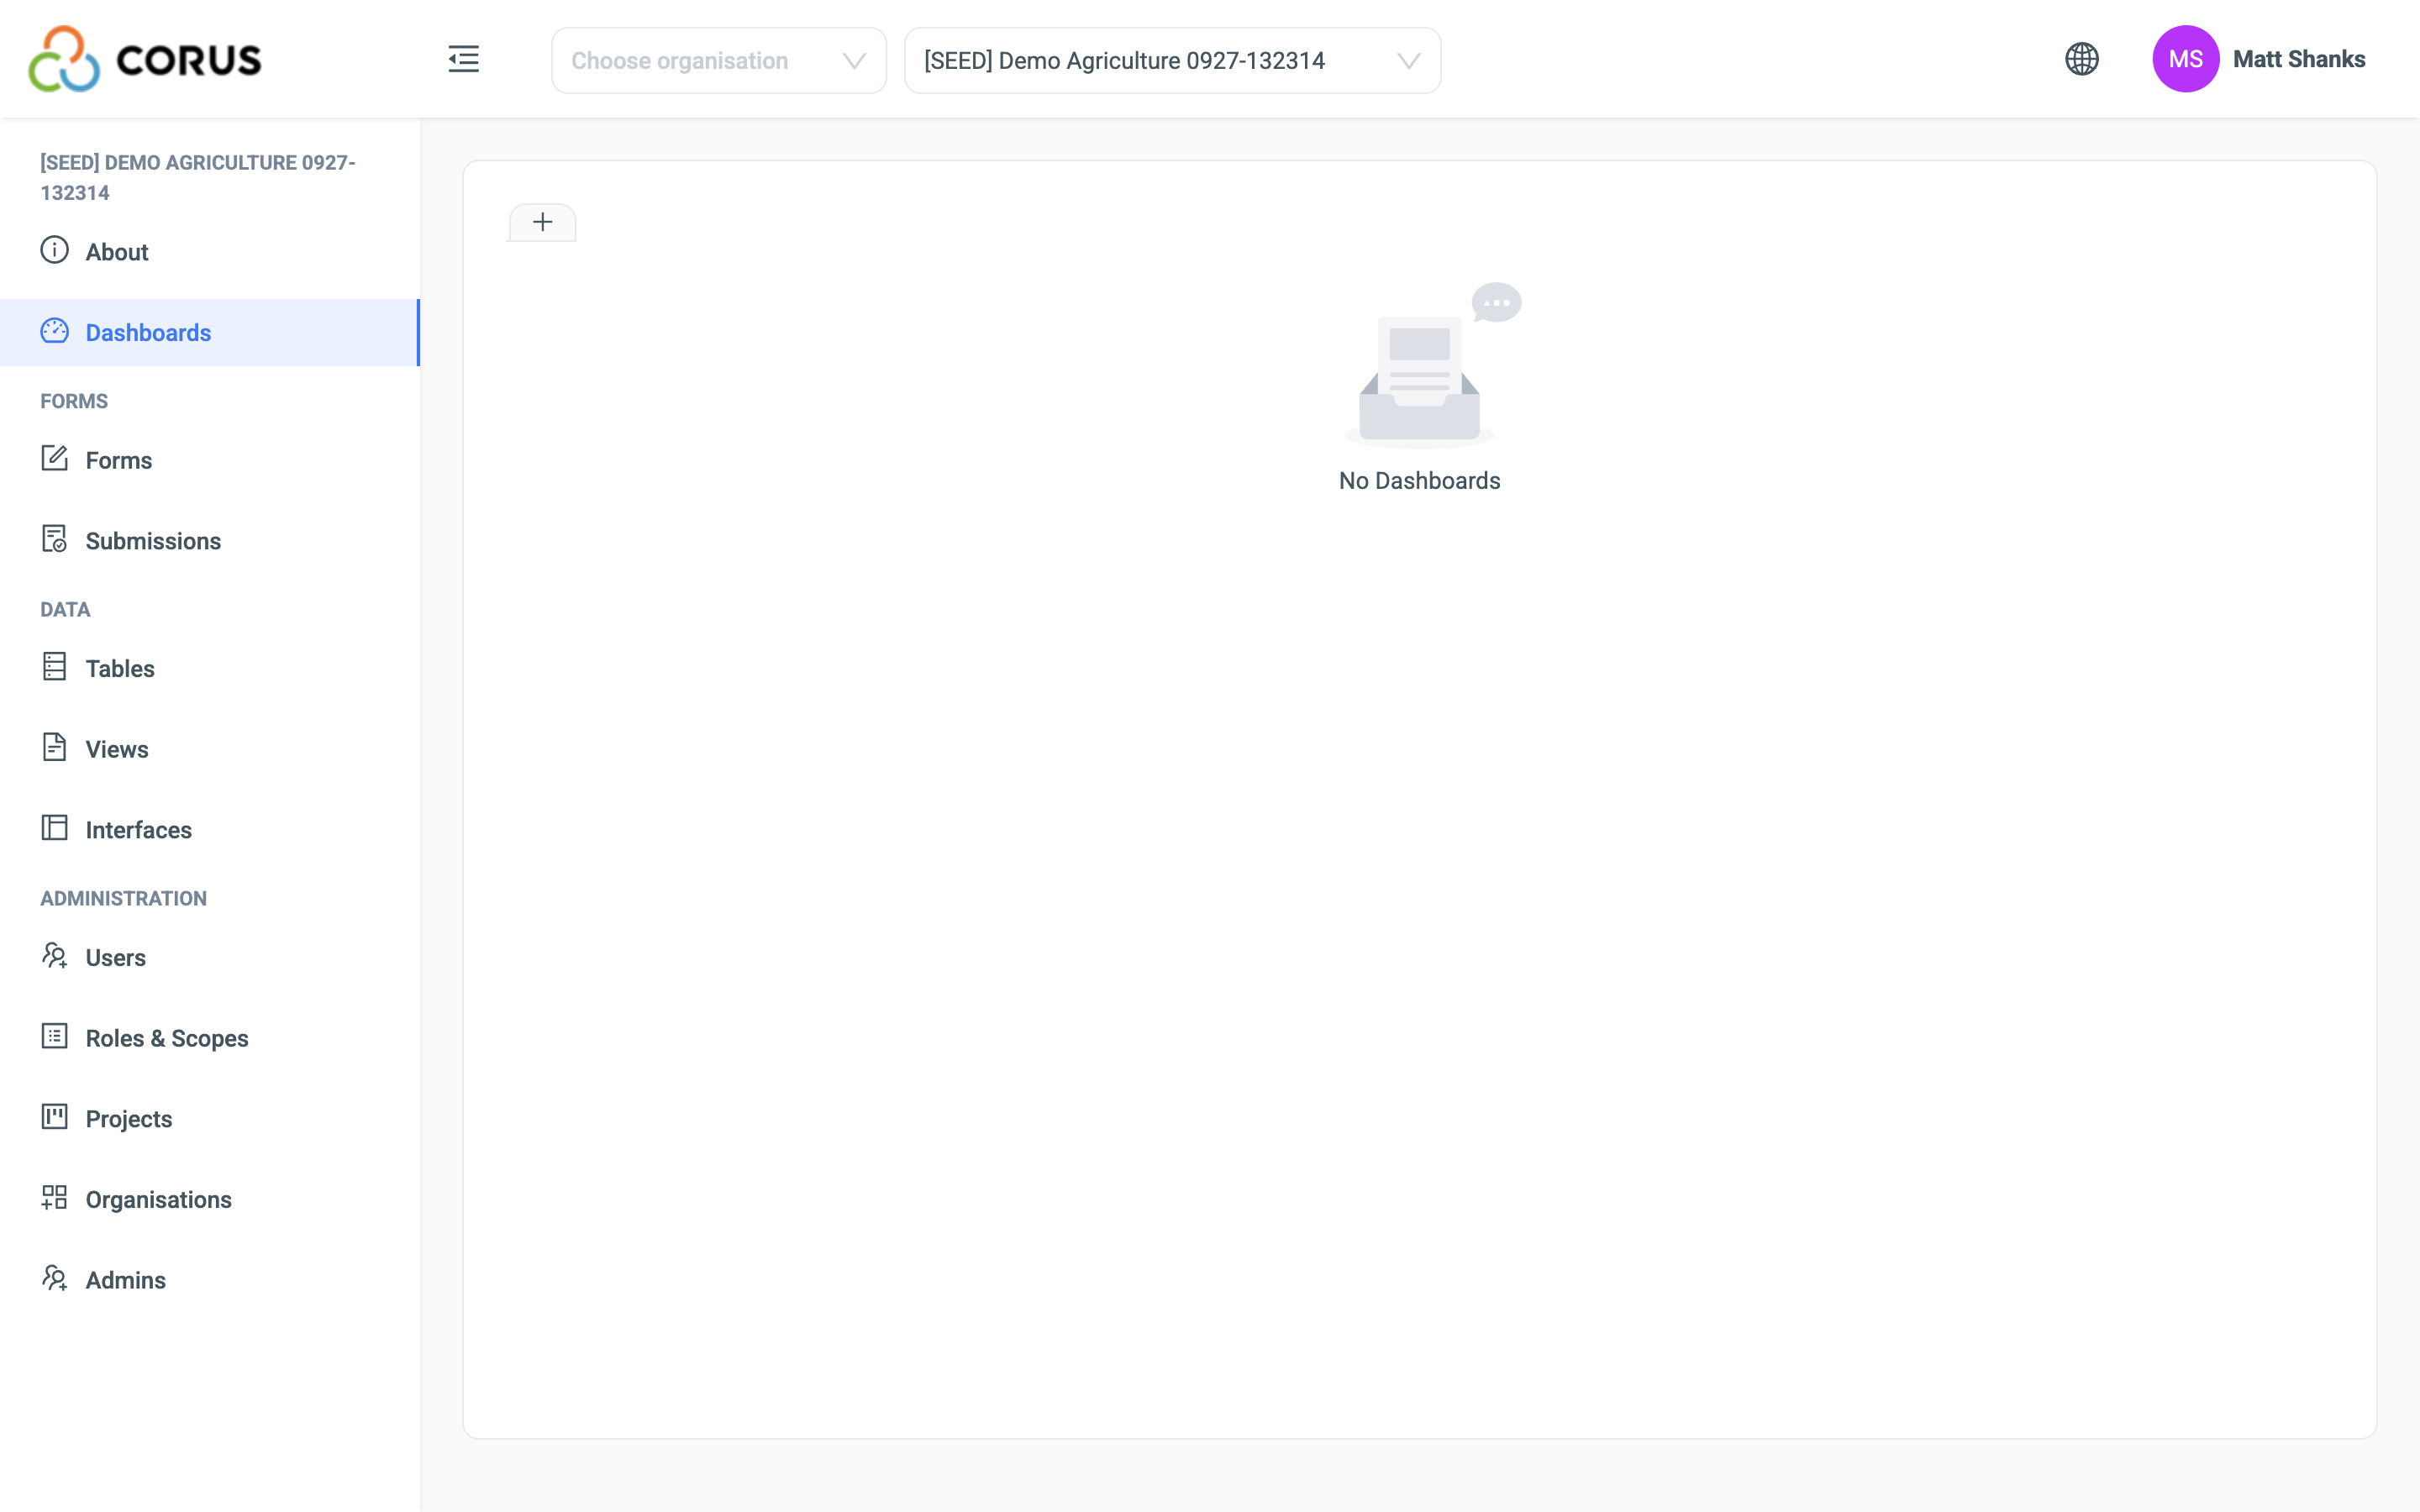
The tabs and the Project report are visible to users with View Dashboards. Adding tabs, sharing and scheduling need Manage Dashboards. See Roles and Permissions.
Warning
Data scoping does not apply to dashboards. A user who can open a dashboard sees the whole project's data in it. See Groups and Data Scoping.
Filters
Most dashboards have filters at the top, such as District or Season. Choose a value and every chart changes to match. The filters are part of the dashboard, built by the analyst in Metabase.
3D remembers the filters you set. A public link or a scheduled email carries the filters that were set when you made it.
Adding a dashboard
- Click + in the tab bar.
- Enter a Name for the tab, 35 characters maximum.
- Under Choose a dashboard, pick the Metabase dashboard. The list shows every dashboard marked embeddable in Metabase.
- Click Create.
Removing a dashboard
Select another tab, then click the × on the tab you want to remove. The tab goes at once, without a confirmation. The dashboard itself stays in Metabase.
Sharing a dashboard
The Actions menu in the top right corner has three options.
Copy Public Link
Copies a link to the dashboard. Anyone with the link can open the dashboard in a browser, without a 3D login, with the filters you had set.
The link is valid for 7 days. Copy it again to renew it. The menu item shows the time left.
Schedule Email
Sends the dashboard by email as a PDF, with a link to the live dashboard, on a schedule.
| Field | Description |
|---|---|
| Recipients | One or more users of the project. |
| Frequency | Daily, Weekly, Bi-Weekly or Monthly. |
| Day of the Week | For Weekly and Bi-Weekly. |
| Day of the Month | For Monthly. A day from 1 to 28, or the last day of the month. |
| Start Date | For Bi-Weekly, the date of the first send. |
| Send Time (UTC) | The time of day, in UTC. |
Click Create. The email carries the filters that were set when you made the schedule.
Note
After three failed sends in a row, 3D pauses the schedule. Check the list of scheduled emails if a report stops arriving.
See Scheduled Emails
Lists every schedule for the dashboard, with its frequency, the last and next send, its status and its recipients. Each row has Pause or Resume, Edit and Delete.
The Project report
A project can have a Project report tab. It shows a Power BI report built from the 3D data warehouse, rather than from Metabase. The tab cannot be removed and has no Actions menu.
The report is set up for your Organisation by the 3D team. While it is being prepared, the tab says so and the report appears on its own when it is ready.
Building a dashboard in Metabase
Dashboards are built in Metabase by an analyst. The 3D team gives analysts access to Metabase and to the project's data there.
Metabase reads the 3D analytics warehouse, not the live database. Every change to a record reaches the warehouse within a few minutes. In the warehouse:
- each Organisation has its own database, and each project its own schema. The 3D team tells you the name of your project's schema,
- each 3D table appears in Metabase as a table with the 3D table's title, with one column per field,
- a Relation field gives two columns, one with the related record's display value and one with its id,
- a Select One field gives two columns, the option label and the stored value, so a value you designed for analysis is there to use,
- a Multi-Select field gives a table of its own, with one row per chosen option, holding the record's id, the label and the value,
- a Cascading Select gives an id and a label per level,
- a Percent field holds the fraction, so 0.75 for 75%,
- a Toggle field is true or false,
- a Nested Form or Matrix field has no column of its own. Its rows are records of the child table, which has a Relation column back to the parent record,
- a GeoLocation field gives latitude and longitude,
- every column has the right type, so dates are dates and numbers are numbers.
3D Views are not in the warehouse. Join the tables in Metabase, on the id column of each Relation field. Build the dashboard, add filters, and mark it embeddable in Metabase. It then appears in the Choose a dashboard list in 3D. The same warehouse feeds the Power BI Project report.